VMware ESXi Esxtop commands
Introduction to Esxtop
Esxtop is a performance monitoring utility for VMware ESXi. It can be used to monitor various performance metrics of virtual machines, hosts, and datastores.

To launch esxtop:
Esxtop can be launched from the command line by running “esxtop” from within an SSH session or the ESXi Shell.
Once esxtop is launched,
it will display a list of counters that can be monitored.
The counters are divided into six categories:
CPU, memory, network, disk adapter, disk device, and power.
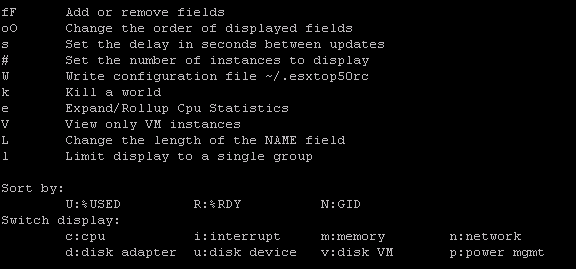
To change the counter that is being displayed, press “c”. To change the category of counters that are being displayed, press “f”.
Esxtop also provides a number of options for filtering and sorting the data that is being displayed. For more information on using esxtop, see the vSphere documentation or type “h” while esxtop is running to display a help screen.
How to use Esxtop commands
In this section, we will take a look at some of the most common esxtop commands and how they can be used to troubleshoot performance issues in your VMware ESXi environment.

One of the most important esxtop commands is “d” for display. This command will show you all of the running processes and their associated resource utilization statistics. This can be very helpful when you are trying to identify which process is causing a performance issue.
Another useful esxtop command is “i” for information. This command will show you detailed information about a specific process or resource. This can be helpful when you are trying to get more information about a particular issue.
The “c” command is also very helpful. It stands for “cpu” and will show you detailed information about CPU utilization. This can be helpful when you are trying to identify if a process is using too much CPU time or if there is another process that is hogging resources.
The “m” command stands for memory and will show you memory utilization statistics. This can be helpful when you are trying to identify if a process is using too much memory or if there is another process that is hogging resources.
The “n” command stands for network and will show you network utilization statistics. This can be helpful when you are trying to identify if a process is using too much network bandwidth or if there is another process that is hogging resources.
The last two commands that we will discuss are “p” for process and “r” for the resource.
The “p” command will show you detailed information about a specific process.
The “r” command will show you detailed information about a specific resource.
These commands can be very helpful when you are trying to troubleshoot performance issues.
The different types of Esxtop commands
There are different types of Esxtop commands, each with a different purpose. The most common commands are:
-d: Displays information about disk activity.
-n: Display network statistics.
-a: Display information about all resource utilization.
-c: Continuous mode – esxtop will continue to run and display updated statistics every few seconds. Use Ctrl+C to exit continuous mode.
Pros and cons of using Esxtop
Esxtop is a powerful performance monitoring tool that can help you troubleshoot and optimize your VMware ESXi environment. However, there are some potential drawbacks to using Esxtop that you should be aware of before deploying it in your environment.
The biggest pro of using Esxtop is its ability to provide near-real-time visibility into the performance of your ESXi hosts and virtual machines. Esxtop can help you identify bottlenecks and hotspots in your environment, and then take corrective action to improve performance.
However, there are some potential downsides to using Esxtop as well.
First, Esxtop can be complex to use and interpret, especially for newcomers to performance monitoring.
Second, because Esxtop runs in a command-line interface, it can be difficult to generate visually appealing reports from its data.
Finally, Esxtop’s data collection methodology is resource-intensive, which means it can impact the performance of the system it’s running on if not used judiciously.
Overall, Esxtop is a powerful tool that can be very helpful in troubleshooting and optimizing VMware ESXi environments. However, it’s important to be aware of its potential drawbacks before deploying it in your environment.
How can Esxtop be used to troubleshoot performance issues in VMware ESXi?
Esxtop can be used to troubleshoot performance issues in VMware ESXi by providing near-real-time visibility into the performance of your environment. Esxtop can help you identify bottlenecks and hotspots in your environment, and then take corrective action to improve performance.
How to interpret the output of Esxtop commands
The output of the Esxtop commands can be interpreted in several ways. The first way is to use the -h or –help flag with the esxtop command to get help on how to interpret the output.
The second way is to look at the man page for esxtop, which will give you a detailed description of each field in the output.
Field name Description
Time – this is the time in seconds since esxtop was started.
PCPU – this is the percentage of total CPU time used by the world since esxtop was started.
CCPU – this is the percentage of total CPU time used by the VMkernel since esxtop was started.
MEMSZ – this is the memory size in MB
%MEM – this is the percentage of memory used
VMRSS – this is the resident set size in MB
%VMRSS – this is the percentage of resident set size used
%USED – this is the percentage of CPU time used
CMD – this is the percentage of time that the CPU was executing commands from any world type (VMkernel, user world, etc.). A high value here may indicate that there are too many commands being issued to the CPU or that there are pending commands that are not being handled quickly enough.
%RDY – this is the percentage of time that the CPU was ready but could not be scheduled for execution due to resource contention. A high value here may indicate that there are not enough resources available for all virtual machines on the host or that some virtual machines are not getting their fair share of resources.
%CSTP – this is the percentage of time that the CPU was in a co-stop state. A co-stop state occurs when multiple virtual machines are sharing the same physical CPU core and one or more of those virtual machines is not ready to run. This can happen when a virtual machine is waiting for I/O or for another process to release a lock on a resource.
%SYS – this is the percentage of time that the CPU was executing system code. This includes code that is part of the VMkernel and any device drivers that are loaded into the kernel. A high value here may indicate that there is a problem with a device driver or with the VMkernel itself.
%USR – this is the percentage of time that the CPU was executing user-level code. This includes code that is part of any virtual machine that is running on the host. A high value here may indicate that there are too many virtual machines running on the host or that some virtual machines are not getting their fair share of resources.
%VMWAIT – this is the percentage of time that the CPU was in a wait state due to activity in a virtual machine. This can happen when a virtual machine is waiting for I/O or for another process to release a lock on a resource.
%RDY – this is the percentage of time that the CPU was ready but could not be scheduled for execution due to resource contention. A high value here may indicate that there are not enough resources available for all virtual machines on the host or that some virtual machines are not getting their fair share of resources.
%IDLE – this is the percentage of time that the CPU was idle. An idle CPU is one that is not executing any code and is not waiting for any I/O operations to complete.
Conclusion
In conclusion, the VMware ESXi Esxtop commands are a great way to monitor your system and get information about what is going on.
This can be extremely helpful when troubleshooting issues or trying to figure out where bottlenecks are. While the commands may seem daunting at first, they are actually quite easy to use once you get the hang of them. With a little practice, you’ll be an expert in no time.